Wi-Fi RSSI heatmap generation using ROSbot 2 PRO
Introduction
Use ROSbot to check the Wi-Fi signal strength in your apartment. This project allows to measure and display RSSI (Received Signal Strength Indication) of a given Wi-Fi network in the desired area, as shown in the video below:
Project overview
The full source code is here:
Wi-Fi RSSI Heatmap Generator application is Docker based and runs on ROSbot 2 PRO and PC, connected over peer-to-peer Husarnet VPN network.
ROSbot
compose.rosbot.yaml file runs the composition of various containers. Details about most of them can be found on the Docker images page. In this project, however, we build only one of them: nav2-wifi-heatmap which contains a custom plugin for Nav2, nav2_read_rssi_at_waypoint responsible for measuring RSSI and sending it to PC over VPN.
# Quick Start
# $ docker compose -f compose.rosbot.yaml up

version: "2.3"

services:

# ROS 2 Galactic

  rplidar:
    image: husarion/rplidar:galactic
    restart: unless-stopped
    devices:
      - /dev/ttyUSB0
    command: >
      ros2 launch
      rplidar_ros2 rplidar_launch.py

  nav2:
    image: nav2-wifi-heatmap
    build: ../nav2-wifi-heatmap
    restart: unless-stopped
    volumes:
      - ~/net_expose:/net_expose
    command: >
      ros2 launch
      nav2_bringup navigation_launch.py
      params_file:=/ros2_ws/config/nav2_params.yaml


  slam-toolbox:
    image: husarion/slam-toolbox:galactic
    restart: unless-stopped
    container_name: slam-toolbox
    volumes:
      - ./config/slam_params.yaml:/slam_params.yaml
      - ./maps:/maps
    command: >
      ros2 launch
      slam_toolbox online_sync_launch.py
        slam_params_file:=/slam_params.yaml

  bridge:
    image: husarion/ros:galactic-ros1-bridge
    restart: unless-stopped
    environment:
      - ROS_MASTER_URI=http://ros-master:11311
    command: >
      ros2 run
      ros1_bridge dynamic_bridge

  ros-master:
    image: ros:noetic-ros-core
    restart: unless-stopped
    command: stdbuf -o L roscore

  rosbot:
    image: husarion/rosbot:noetic
    restart: unless-stopped
    devices:
      - ${SERIAL_PORT}
    environment:
      - SERIAL_PORT
      - ROS_MASTER_URI=http://ros-master:11311
    command: >
      roslaunch --wait
      rosbot_bringup rosbot_docker.launch
PC
Containers running on a PC (eg. your laptop) provide tools for mapping the desired area (using RViz's goal_pose). They also contain mapper_packages which are responsible for defining measurement points based on the saved map, receiving RSSI measurement data from ROSbot and generating RSSI heatmaps using 2D interpolation based on received data.
Apart from being used as intended, this project can also serve as a guide on how to:
- use Husarnet to share data between ROSbot and your PC, which can allow you to develop more complex and demanding applications.
- create plugins for Nav2 Waypoint Follower, making it easy to change ROSbot's behaviour according to your needs
# Quick Start
# $ xhost local:root
# $ docker compose -f compose.pc.yaml up

version: "2.3"

services:

#ROS Galactic
  mappers:
    image: mappers
    build: ../mapper-packages
    restart: unless-stopped
    tty: true
    volumes:
      - /~/map:/map
      - /~/heatmaps:/heatmaps
      - /tmp/.X11-unix:/tmp/.X11-unix:rw
    environment:
      - DISPLAY
      - LIBGL_ALWAYS_SOFTWARE=1

  rviz:
    image: husarion/rviz2:galactic
    restart: on-failure
    volumes:
      - /tmp/.X11-unix:/tmp/.X11-unix:rw
      - ./config/rosbot_pro_mapping.rviz:/root/.rviz2/default.rviz
    environment:
      - DISPLAY
      - LIBGL_ALWAYS_SOFTWARE=1
Setup
1. Get Husarnet Join Code
Create a Husarnet network according to this tutorial and find your Join Code allowing you to connect different hosts to the same VPN network.
You will find your Husarnet Join Code on your account at Husarnet Dashboard:
- Log in to https://app.husarnet.com/
- Select or create a network
- Click [Add element] button and select a Join Code tab:
Join Code looks like this:
JOINCODE=fc94:b01d:1803:8dd8:b293:5c7d:7639:932a/xxxxxxxxxxxxxxxxxxxxxxxxxxxxxxx
2. Clone contents of this repository to your PC and ROSbot:
git clone https://github.com/husarion/rosbot-demo-wifi-heatmap.git
- Create '.env' file inside 'docker-compose' folder and paste your husarnet joincode and generate DDS config files:
./generate-vpn-config.sh
This will create secrets file, which you need to copy to the same directory on another device.
JOINCODE=fc94:b01d:1803:8dd8:b293:5c7d:7639:932a/xxxxxxxxxxxxxxxxxxxxxxxxxxxxxxx
4. Run Docker containers on ROSbot:
Run bash script exposing /proc/net/wireless data to container:
chmod +x rosbot-demo-wifi-heatmap/net_expose.sh
rosbot-demo-wifi-heatmap/net_expose.sh &
Launch containers:
cd rosbot-demo-wifi-heatmap/docker-compose
docker compose -f compose.rosbot.yaml -f compose.rosbot.husarnet.yaml up
4. Run Docker containers on PC:
Run script enabling RViz:
xhost local:root
Launch containers:
cd rosbot-demo-wifi-heatmap/docker-compose
docker compose -f compose.pc.yaml -f compose.pc.husarnet.yaml up
Usage
Mapping
At first, an appropriate map of the desired area needs to be created using RViz goal pose, which allows the user to pass waypoints to the robot. While reaching those waypoints ROSbot will map the area around it thanks to the SLAM toolbox. Several important things must be considered while mapping and choosing the environment to map:
- Points too close to obstacles or unknown areas will not be marked as waypoints
- The fewer obstacles, the better because ROSbot will be able to measure RSSI in more waypoints, resulting in a more accurate heatmap at the end
- Remember that some obstacles are invisible to ROSbot's lidar for example transparent surfaces or obstacles located under the lidar's view
Autonomous heatmap generation
After the desired area is mapped, execute the following command on your pc to start the process of autonomous measurement:
docker exec docker-compose-mappers-1 /run.sh
After running this command a map will be displayed with waypoints marked. Green ones are actual waypoints marked for measurement, while the red ones were considered too close to obstacles or unknown areas. Remember that in the areas with fewer waypoints, data will also be less accurate (less data for interpolation). ROSbot will start going through all green waypoints, measuring RSSI for ten seconds in each one and sending data to a ROS2 node on pc.
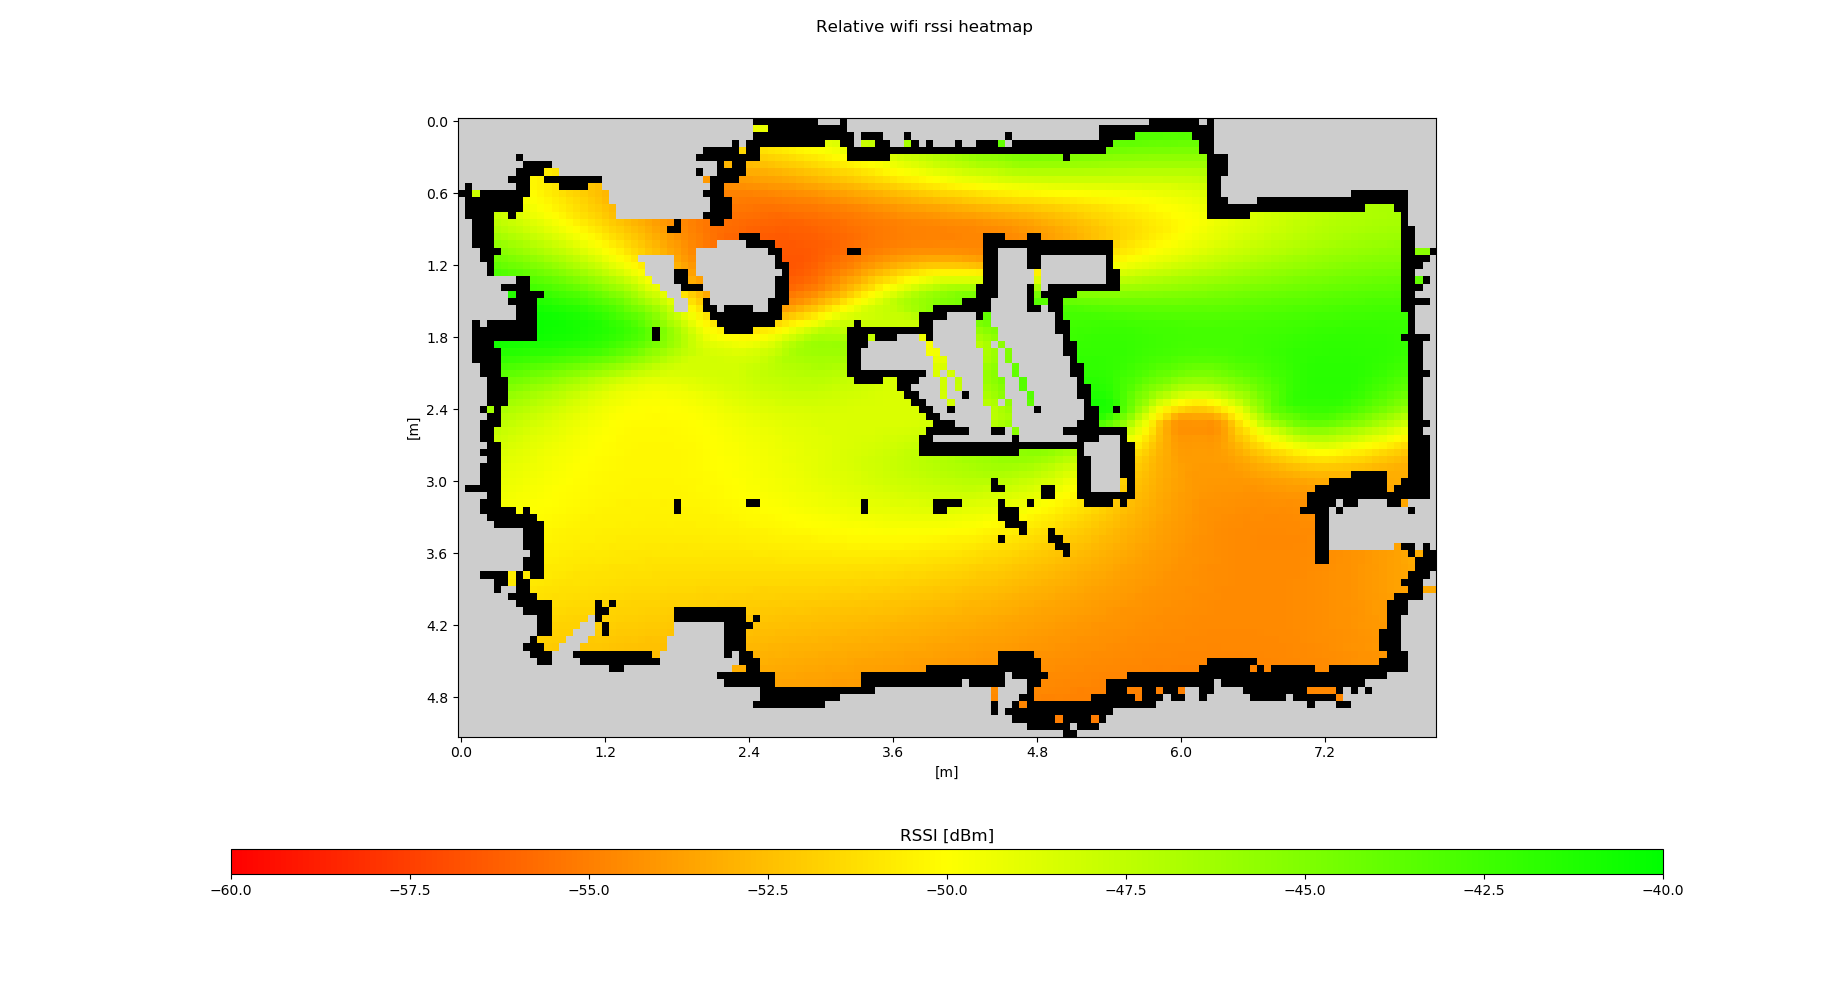
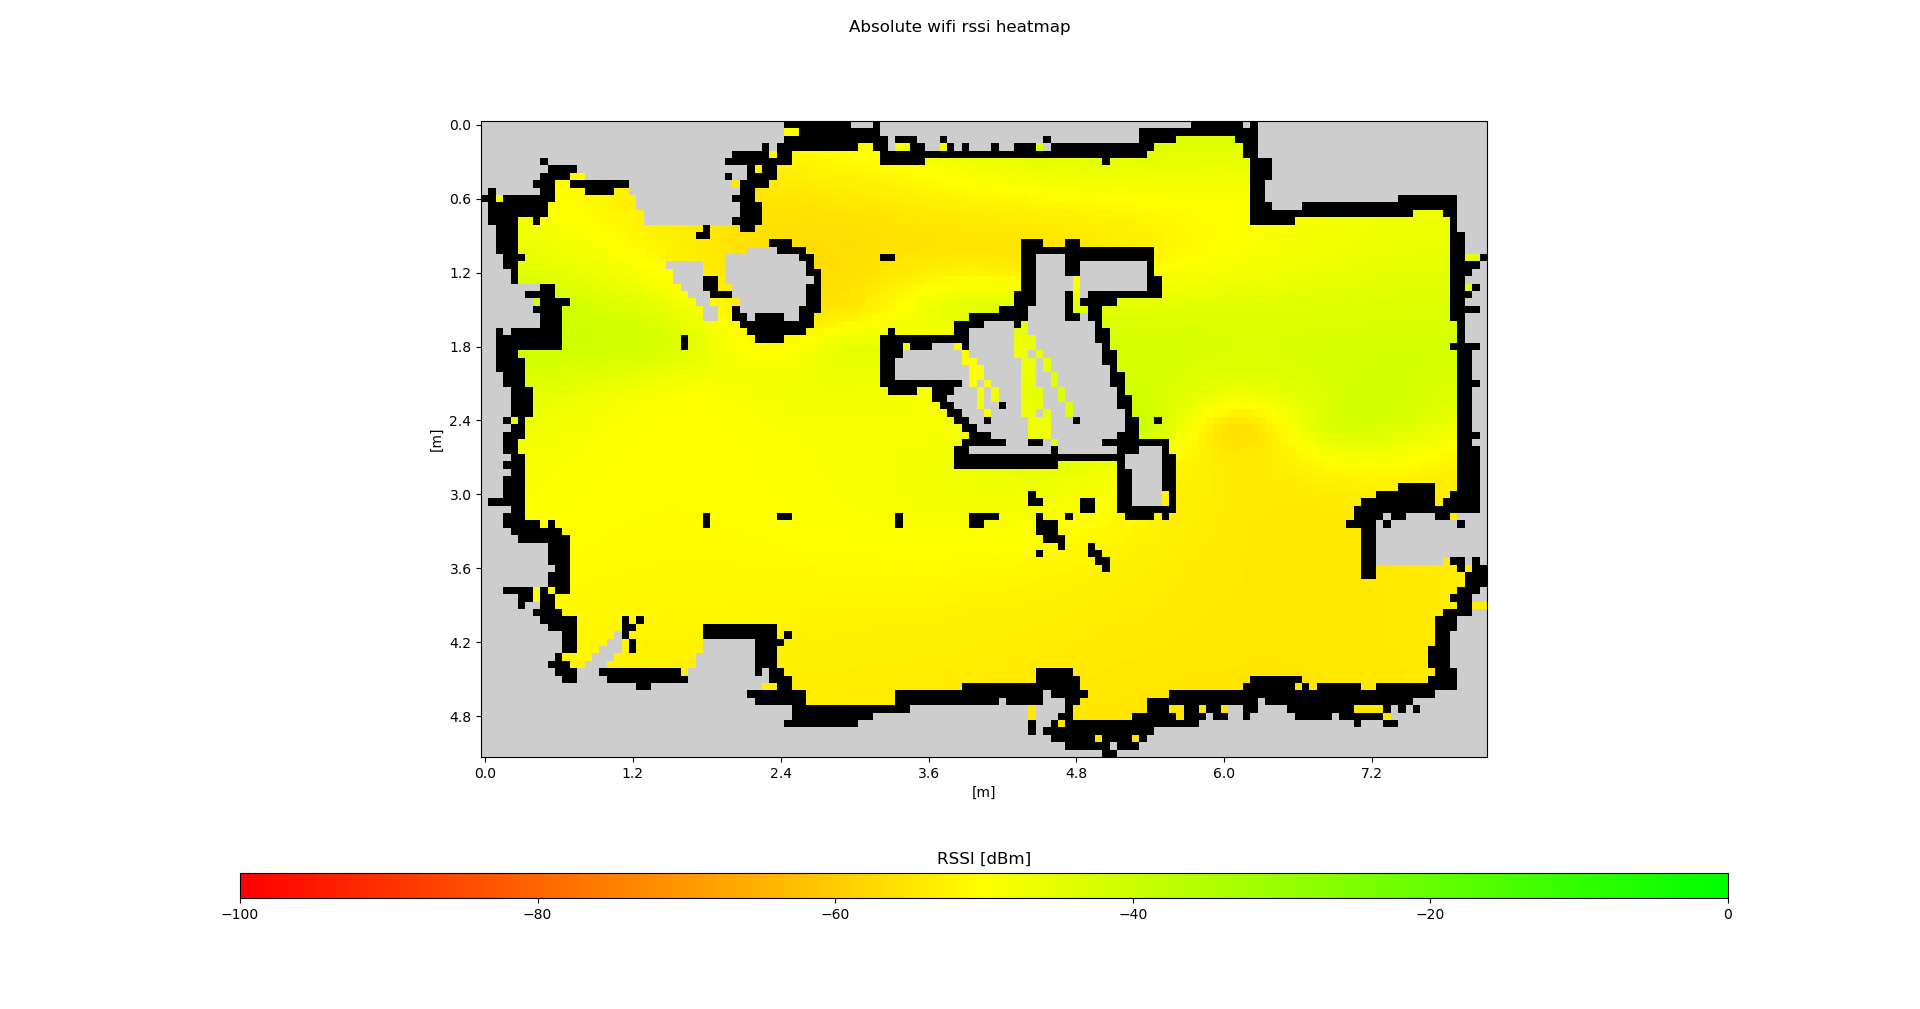
Displaying results (the heatmap)
After all the waypoints have been achieved, two heatmaps will be generated based on the collected data. Raw images will be saved in /heatmaps folder. For full figures with heat bars use the SAVE button in matplotlib GUI and save images in '/heatmaps' directory, which at default is mounted on the folder with the same name in your home directory.
Here are the results of running this application:
by Stanisław Dudiak Husarion
Need help with this article or experiencing issues with software or hardware? 🤔
- Feel free to share your thoughts and questions on our Community Forum. 💬
- To contact service support, please use our dedicated Issue Form. 📝
- Alternatively, you can also contact our support team directly at: support@husarion.com. 📧